
Most AI visibility reports answer the wrong question.
For example, they tell you a brand shows up in 42% of category responses. They don’t tell you which prompt got it there, what AI cited to support the mention, or whether any of that is something the brand can actually move.
After running deep AI visibility analyses for enterprise brands over the last several quarters, the pattern that keeps biting teams is the same one:
AI doesn’t have one citation behavior. It has three:
- When users ask about a category without naming a brand, AI leans on community discussions and third-party content, Reddit, LinkedIn, research orgs. Owned content is a minority contributor.
- When users name the brand, owned content dominates. More than 60% of citations come from the brand-owned properties.
- When users ask AI to compare brands, owned content and earned media carry near-equal weight. And this is where most brands quietly lose: their owned domains drop out of the top citations entirely, replaced by competitors’ owned ecosystems.
Three prompt types. Three different content strategies. Most reports average across all three and report one “visibility score” that hides every gap that actually matters. So it’s like the single-number visibility score is the marketing equivalent of a stock ticker. It tells you something is happening. It doesn’t tell you what to do about it.
What follows is the AI Citation Framework I’ve landed on to replace it. Five components, designed to turn AI visibility from a vanity dashboard into a working planning input.
Component 1: Segment by prompt type, or don’t bother measuring.
AGAIN, AI doesn’t have one citation behavior. It has three, and they show up clearly in any deep visibility analysis.
When users ask about a category without naming any brand, like “What are the largest cloud infrastructure providers?”, AI leans heavily on community discussions and third-party content. Think Reddit, LinkedIn, research orgs, or Wikipedia. Much like its predecessor Word-of-Mouth, Word-of-Bot is going to become a very powerful tool that sits between your brand and the customer. In recent research, community and third-party sources accounted for roughly 69% of cited sources at this awareness stage. A brand’s own website is a minority contributor.
When users name a brand directly, such as “How does [Brand] approach sustainability?”, owned content dominates. Our client work has shown us that more than 60% of citations come from brand-owned properties.
When users ask AI to compare brands, like “Compare [Brand A] and [Brand B] on cost,” that’s when owned content and earned media carry near-equal weight. In the engagement I’m referencing, the brand’s own domains dropped out of the top five citations entirely at the head-to-head stage. Competitor-owned content filled the space.
Each prompt type leads to a different content strategy. A team that’s strong on owned content and absent from earned media will look great on branded prompts and disappear on head-to-head. That asymmetry is the single most common gap I see in enterprise GEO work, and it’s invisible if you’re only tracking aggregate visibility.
Component 2: Look beneath the visible citations.
When you read an AI response, you usually see a handful of links at the bottom. Those direct citations are the visible layer and the smallest. In my recent work, that visible layer was about 200 articles per quarter.
AI doesn’t just learn from direct citations. It also pulls from two other layers of coverage:
- Tier 2 (one link away): Articles that weren’t cited directly but linked to the sources AI did cite — drawing from the exact same research and content ecosystem
- Tier 3 (broader media landscape): Thousands of unlinked articles on the same topics. These form the overall narrative that shapes what AI views as important, even without a direct link connection.
Also, the ratio matters. Direct citations were 1% of the relevant ecosystem. The rest was the substrate AI absorbed.
A piece of earned media that never gets cited can still drive AI visibility by pointing AI at a source it trusts. In one case from this work, a news article never appeared in any AI response, but the research org page it linked to was retrieved by AI more than 1,000 times across multiple category queries. The article’s value was navigational, not citational. A measurement framework that stops at the visible citation layer misses that value entirely.
Component 3: Stop collapsing three metrics into one.
Visibility, Share of Voice, and Mentioned Position are three distinct metrics that serve different measurement purposes.
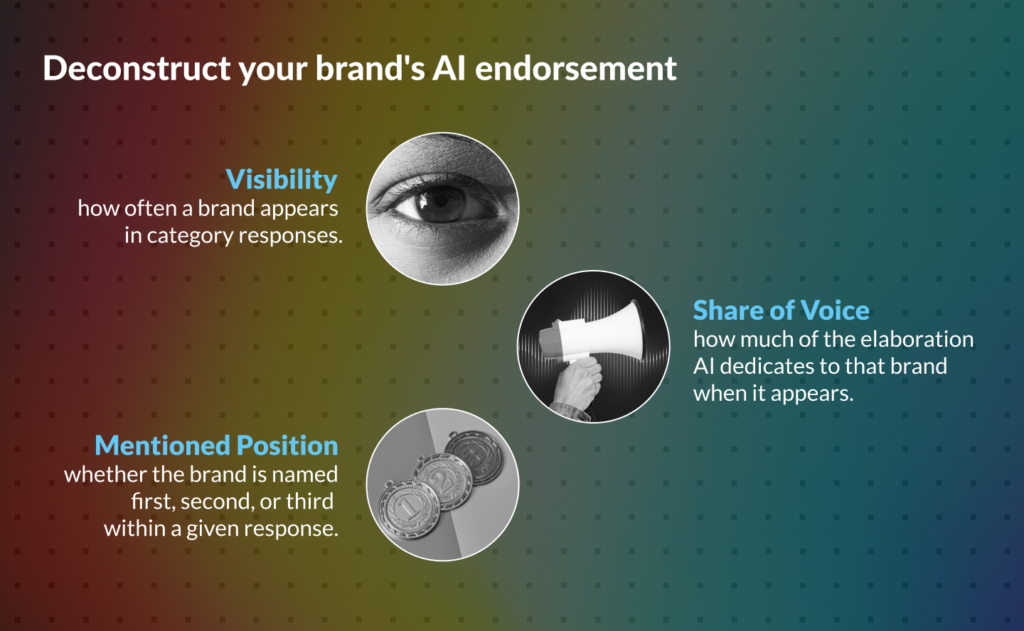
Visibility is how often a brand appears in category responses. Share of Voice is how much of the elaboration AI dedicates to that brand when it appears. Mentioned Position is whether the brand is named first, second, or third within a given response.
These decouple. In recent work, a global tech brand we were studying led category Visibility by 13 points over its nearest competitor, but trailed by about a point on Share of Voice, because when AI mentioned the competitor, it went deeper. More services. More locations. More features.
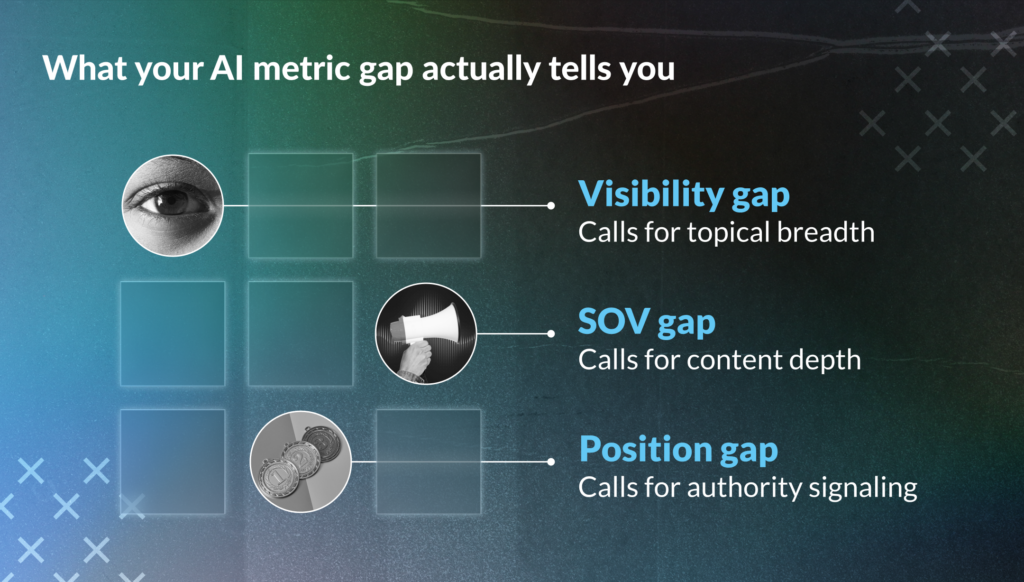
Each gap points at a different fix. A Visibility gap calls for topical breadth. An SOV gap calls for content depth. A Position gap calls for authority signaling. A single aggregate score makes all three invisible.
Component 4: Split mainstream and specialist engines.
In every engagement, the same brand performs measurably differently across ChatGPT, Gemini, Claude, and Perplexity. This variance isn’t random noise – it’s a diagnostic signal.
Mainstream engines like ChatGPT and Gemini privilege volume and breadth of coverage across the web. Specialist engines like Claude and Perplexity privilege authority and citation density. A brand that’s at parity with a competitor on the specialist engines but trails by several points on the mainstream ones has a distribution problem, not a quality problem. The fix is wider seeding of content, not deeper content production.
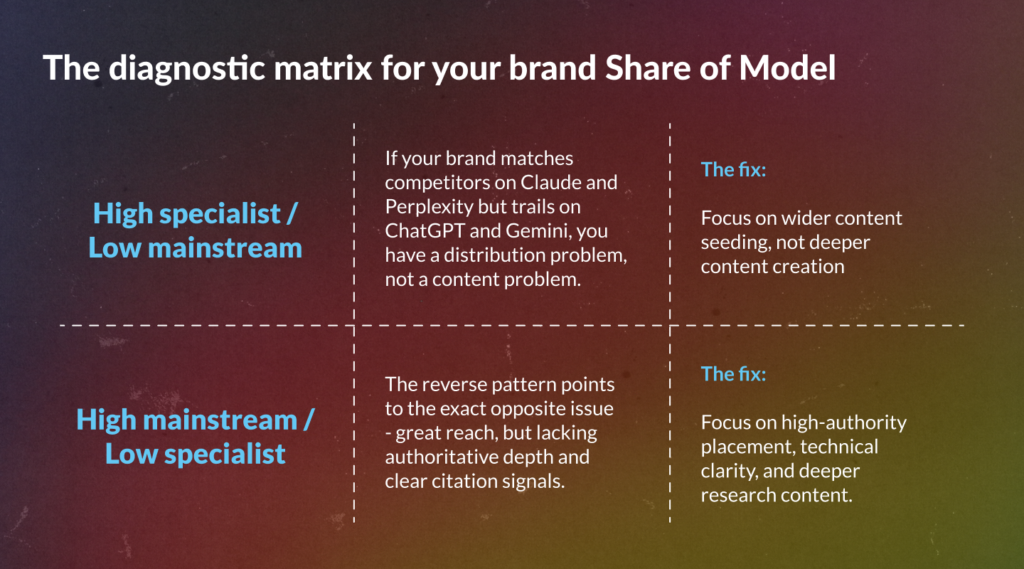
The bottom line? Averaging your brand’s performance score across all four engines flattens this vital signal into useless noise. Measure them by archetype to know what to actually fix.
Component 5: Reduce to what you can actually move.
To make the above framework actionable, focus only on data you can actually control and remove the rest. After measuring everything AI cited, strip out the third-party content like Wikipedia, research orgs, government sites, and university pages. Brands can’t directly publish to those sources and trying to influence them takes months, not weeks.
What’s left is the Influenceable Landscape: earned media, owned content, and community channels. That’s where the content strategy lives and how brands can approach different audiences. For example, at the awareness stage (unbranded prompts) citations are broken down to roughly 33% earned media, 11% owned, 56% community. At the comparison stage, owned and earned media were closer to even, at 41% and 37%. Those proportions are what a quarterly content plan should be built against, not the unfiltered citation mix.
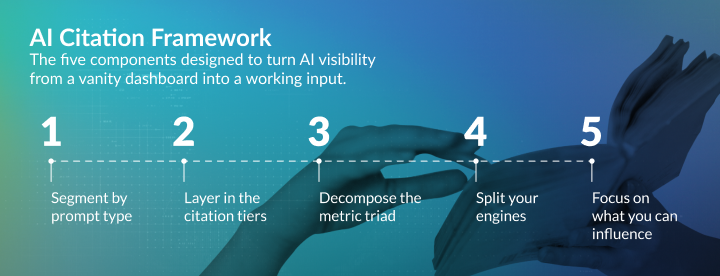
None of these are tools. They’re the questions a working framework forces a team to answer before it ships a report. A report that can answer them gives the marketing team something to act on. A report that can’t is a dashboard, not a decision input. The difference is why most AI visibility isn’t generating enough business value to justify the investment behind it.
The bar isn’t whether the score moved. The bar is whether the team that produced it can tell you what to do next.
++Methodology
Methodology: This analysis evaluated 72K AI-generated responses, produced through 18K prompt runs conducted over a three-month period. A consistent set of 200 prompts was tested daily across ChatGPT, Perplexity, Gemini, and Claude. Two specialized AI visibility platforms, Peec AI and Profound, were used to measure brand mentions, share of voice, and citation patterns relative to the primary competitors.
To examine the relationship between the broader media landscape and the sources referenced by AI models, we cross-referenced more than 30K social posts and news articles published during Q1 2026 with the 1K most frequently cited URLs in AI-generated responses related to client business. This approach enabled us to assess which earned media sources were reflected in AI outputs and identify influential citation sources operating outside the broader media conversation.